Pros & Cons of Report Charts vs Visualforce Charts
 In my previous post, I demonstrated some tricks in creating a stacked bar chart using Visualforce Charting which inspired me to write this post about Report Charts vs. Visualforce Charts on Pages. Report Charts on pages is the latest addition to the Page Layout customization, which came with the Winter’14 release of Salesforce.com. I think it is a very cool feature because the users can see a summary of the important data related to the Record that is right on the detailed page. This allows any non-developer system admin to implement it in a short time.
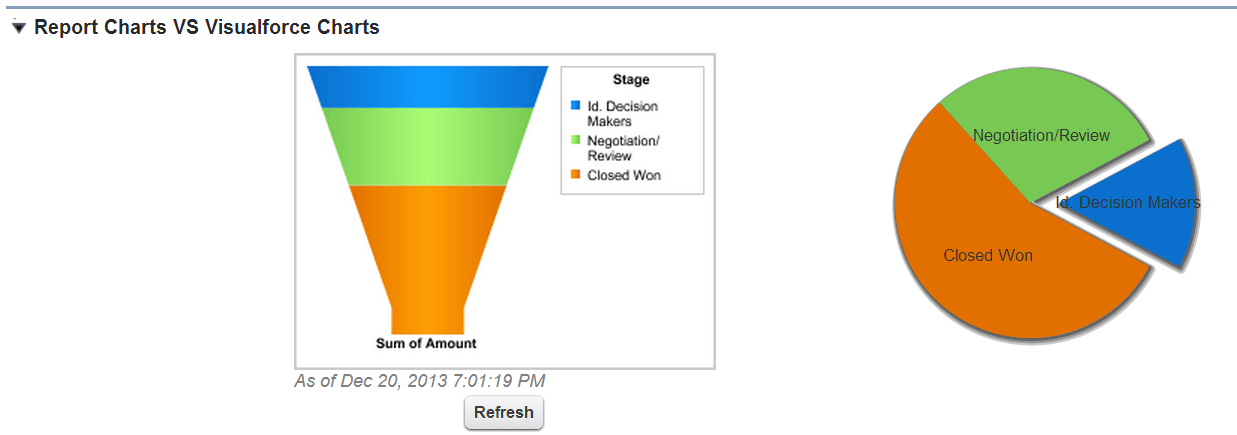
I know that some companies have used Visualforce Charts on pages before the Report Charts came out, so I would like to share some pros and cons on these two types of Chart on pages.
Breaking down Report Charts
Report Chart Pros
- Easy to set up and no code required.
- Any custom summary report with the chart can be added to the page (it must not be in My Personal Custom Reports folder.)
- The source report doesn’t have to have an ID Filter.
- The chart is automatically filtered by the record ID if the Report Type matches the record on the page (except an Account page that is set to filtered by Parent Account ID by default but this can be changed under the chart properties.)
- It inherits org-wide sharing and sharing rules. That means the Users will only see the values of records they own in the chart if the sharing for the Object in the chart is set to “Private.”
Report Chart Cons
- Limits only 2 charts per page.
- On detail pages, Users can refresh up to 100 report charts every 60 minutes.
- Your organization can refresh up to 3,000 report charts every 60 minutes.
- You are stuck with the standard chart types.
Breaking down Visualforce Charts
Visualforce Chart Pros
- No limits on refresh because the Visualforce renders the real-time data.
- No limits on numbers of charts per page.
- Nice animation.
- You have a choice to bypass the org-wide sharing and sharing rules by setting the Controller to “public without sharing.”
- You can go beyond the standard Salesforce chart types.
Visualforce Chart Cons
- Need Developer skills (for Apex Controllers, Visualforce Pages and Visualforce Components.)
- You cannot drill down to the standard source Report.
- You cannot use a standard controller for a Visualforce page that contains the chart. You have to write a chart in a Visualforce Component using a custom controller and put the component inside a Visualforce page with the standard controller of the object that you want to put the chart on the page.
Now it’s time for you to decide which one you prefer to use on your Pages!