Use Salesforce Custom Summary Formulas to Track Target vs Actual?
 Is Salesforce’s Forecasting functionality too frustrating or heavy for your Sales KPI needs, but you still need to report actual versus target sales results? Don’t want to purchase and install an app from the Appexchange to provide what feels like fundamental functionality?
Well then, look no further than Salesforce’s out-of-the-box custom summary formula functionality!
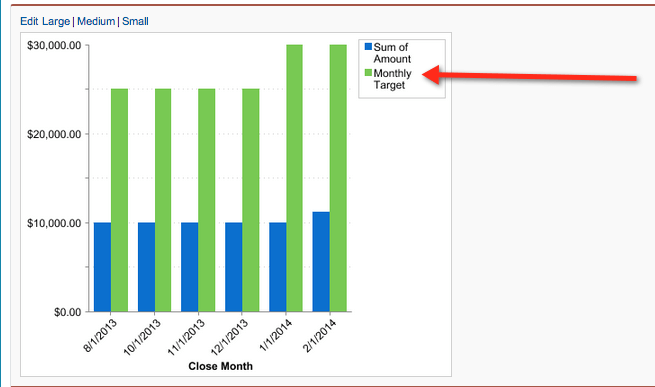
By using a Custom Formula, we can look at actual versus target results using a vertical bar chart with two plotted values (see example chart below).
Custom Summary Formulas for Reports allow you to calculate values on-the-fly in a report without adding Fields or adding additional meta structure to your Salesforce org.
Working with Custom Summary Formulas is very similar to working with Formula Fields, with the limitation that ONLY Summary Fields are available for use, and you have to reference SUM, MAX, MIN, or AVG.
Create a Report: Closed Won Actual v Target
Coming back to our original business need to create actual versus target reporting for a sales rep, let’s create a report with a monthly target for 2013 of $25,000, and a slightly higher target for 2014 of $30,000, called ‘Closed Won Actual versus Target.’
Step 1: Create a Opportunity Summary Report and summarize by Close Month.
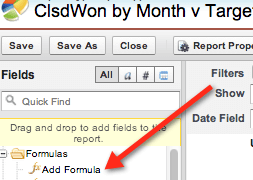
Step 2: Create a report formula by clicking ‘Add Formula’.
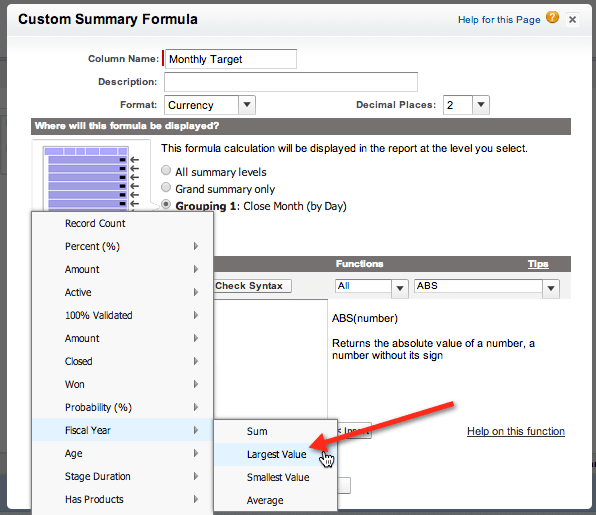
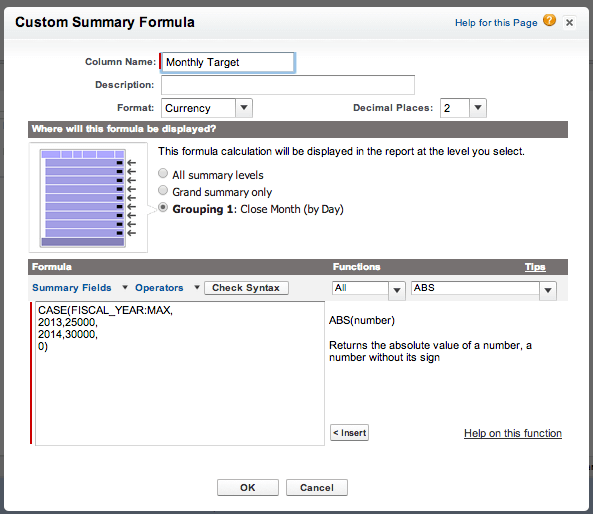
Step 3: For reporting against a set monthly target use a CASE formula with FISCAL_YEAR:MAX as the referenced field.
Formula:
CASE(FISCAL_YEAR:MAX,
2013,25000,
2014,30000,
0)
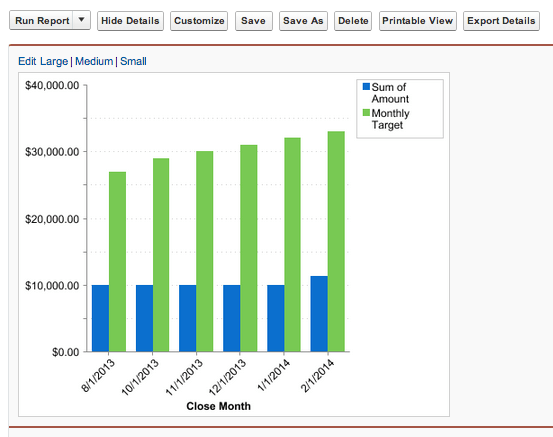
Step 4: Run the report and receive the following results. Note that the Monthly Target changes when the results move into 2014, changing from $25,000 per year to $30,000 per year.
Bonus Challenge: Changing Monthly Targets
Let’s say that your sales cycle is seasonal, and you want to have different targets on a monthly basis – for example, targets rise by a $1,000 per month.
In order to get this level of granularity, we will have to create a Custom Number Field on Opportunity called something like Close Month # (Number (2,0)), and a workflow to update the field when the Opportunity Record is created or the close date is modified. Once we have this field populated, we can create a Custom Summary Formula using a combination of IF THEN and CASE functions like so:
IF(FISCAL_YEAR:MAX=2013,
CASE(Opportunity.Close_Month__c:MAX,
1,20000,
2,21000,
3,22000,
4,23000,
5,24000,
6,25000,
7,26000,
8,27000,
9,28000,
10,29000,
11,30000,
12,31000,0),
IF(FISCAL_YEAR:MAX=2014,
CASE(Opportunity.Close_Month__c:MAX,
1, 32000,
2, 33000,
3,34000,
4,35000,
5,36000,
6,37000,
7,38000,
8,39000,
9,40000,
10,41000,
11,42000,
12,43000,0),0
)
)
Any questions? Please feel free to leave a comment below, or contact our team for any additional questions regarding Forecasting!