Is it Magic? No, it’s forecasting!

In Winter ’12, Salesforce unleashed Forecasting 3.0 in order to try to charm Users worldwide into a new relationship with the New! Improved! Forecasting. Up until now, both the (old, old) Forecasting and Customizable Forecasting have been under-utilized due to perceptions of over-complexity and inflexibility. Will you fall under the spell of the new Forecasting Functionality?
First, an Overview from Help.Salesforce.com:
“Using Forecasts, you can predict and plan your sales cycle from pipeline to closed sales, and manage sales expectations throughout your organization.”
What does this mean? Here is a list of forecast definitions for such magic words as Adjustments, Forecast Category, and Forecast Hierarchy, and here are the highlights in plain English:
- Interactive:
- Change forecast date ranges
- View your own, your subordinates’, and your team’s Forecasts.
- Forecast details: who made adjustments and original forecast amounts, and the ability to adjust these details.
- Opportunities:
- Dynamically updating lists based upon forecast category selection
- Direct links to opportunities
- List View functionality.
- Support for multiple currencies.
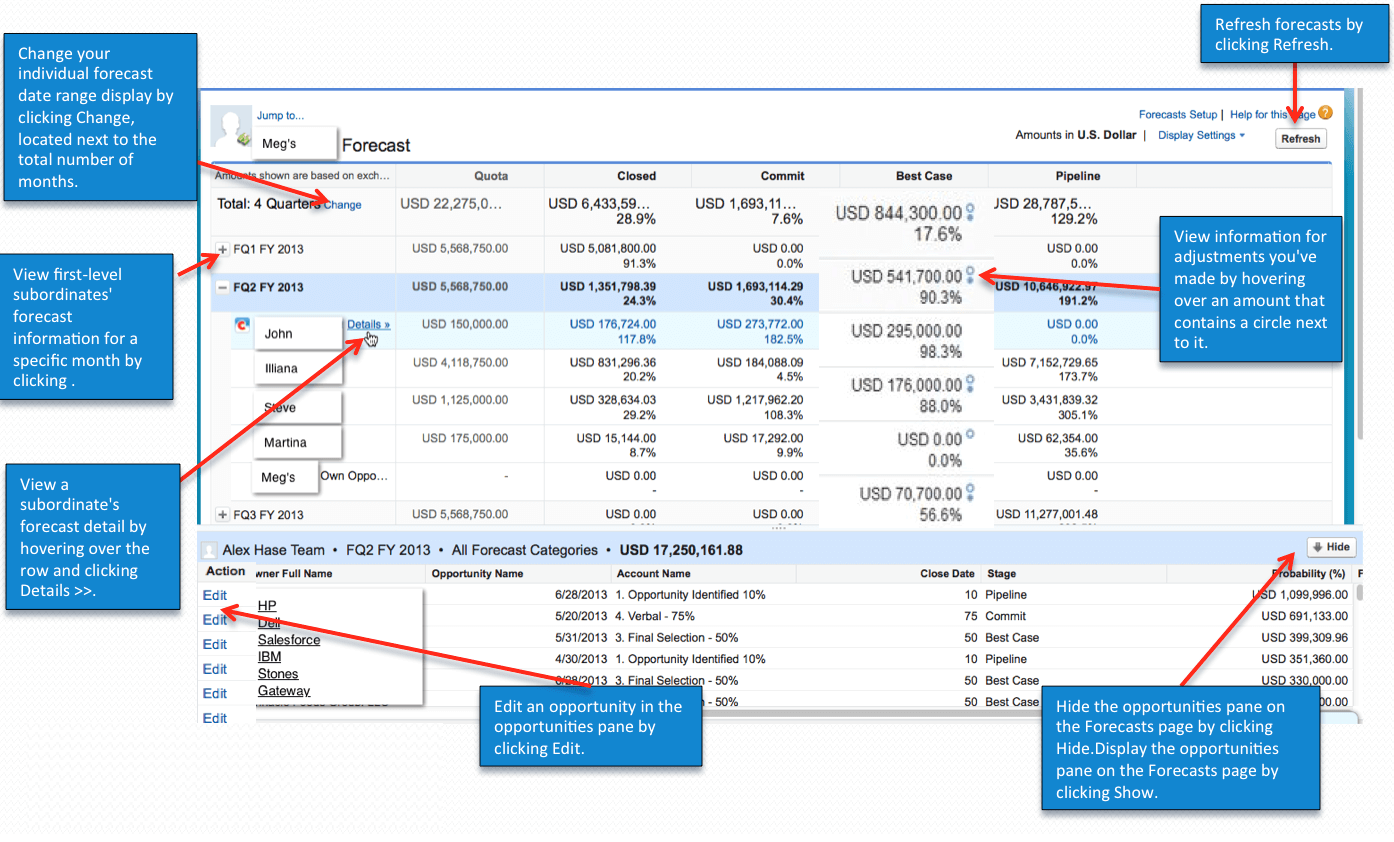
Below is a nice screenshot with call-outs of various areas of the Forecasts tab:
What are the differences between Winter ’12 Forecasts and Customizable Forecasting?
When Winter ’12 Forecasts was first released, it had more limited functionality, but as of this writing more and more features that Customizable Forecasting has have been added to Forecasts, including the ALL important Quotas functionality (some Gotchas! here that I will discuss below). Forecasts still doesn’t allow customizable fiscal years and Opportunity-level adjustments, as well as some other items, but in my book, most of the key reagents (i.e., magical ingredients) of Customizable Forecasting are now available for Forecasts.
Are you an Adept (i.e., Forecast Manager) or an Apprentice?
Again from Help.Salesforce.com:
“The forecast hierarchy is a nested, expandable list of forecasts users. It determines how forecasts roll up within the organization, and who can view and adjust them.”
The Forecast Hierarchy (imported from the Role Hierarchy), and especially the designation of Forecast Manager, determine viewing privileges of the User.
Straight from Salesforce Help:
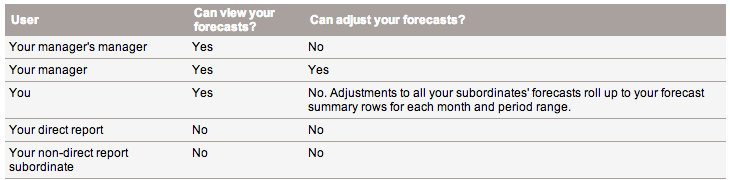
Who can view and adjust your forecasts?
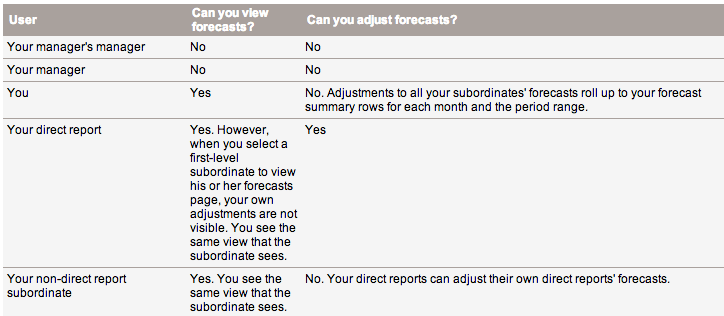
Whose forecasts you can view and adjust?
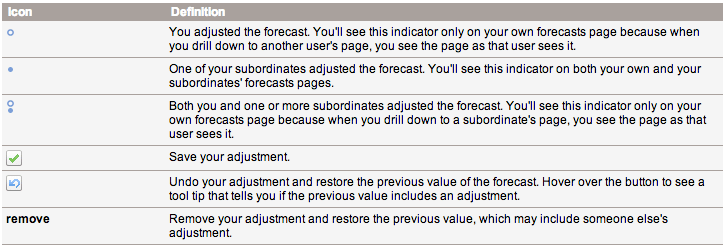
If a forecast contains adjustments, you’ll see one or more icons next to the amount. Here’s what they mean.
Probably one of the main times when Forecast Hierarchy is very useful is when there are multiple levels in the Sales organization, and everyone wants to maintain high levels of motivation. For example, the SVP of Sales is making a presentation to the Board. The Board wants to see the KPIs from the VP of Sales’ perspective. The SVP doesn’t want to de-motivate her Reps, but she needs to provide a ‘realistic’ view to the Board. With Forecasting, it’s easy because she can add Adjustments to her reps’ Forecasts, but her reps forecasts remain unchanged as far the reps are concerned. Confused? Don’t be! Simply think of Adjustments as additional ‘layers’ that are added or subtracted without losing the original Forecast data.
A little more insight into Adjustments
A few more points about Adjustments:
- Must be turned on for your organization.
- May be made to gross opportunity amounts only.
- May be made to forecasts that have already been adjusted by someone else in a sales team.
- Does not change the underlying gross rollup—it just adds a layer of detail.
- Adjustments can be purged (i.e., removed) from forecasts. Click here to find out more.
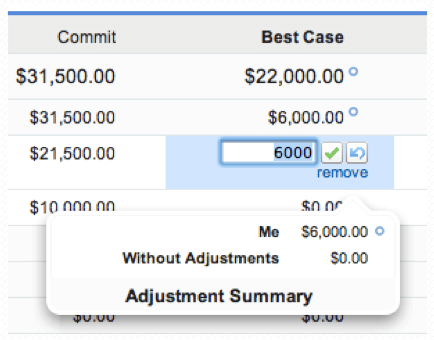
Here is a screenshot of a User making an Adjustment:
Cursed (Gotcha)!
From my perspective, there are four main Gotchas with Forecasts:
- Quotas must be loaded via API (e.g., Data Loader, Workbench, Jitterbit, etc.)
- Quotas DON’T roll up my hierarchy, so for example, you have to add up all of the Sales Execs quotas for North America, and give the North America Sales Team Manager her own quota equal to the sum of all the Sales Execs
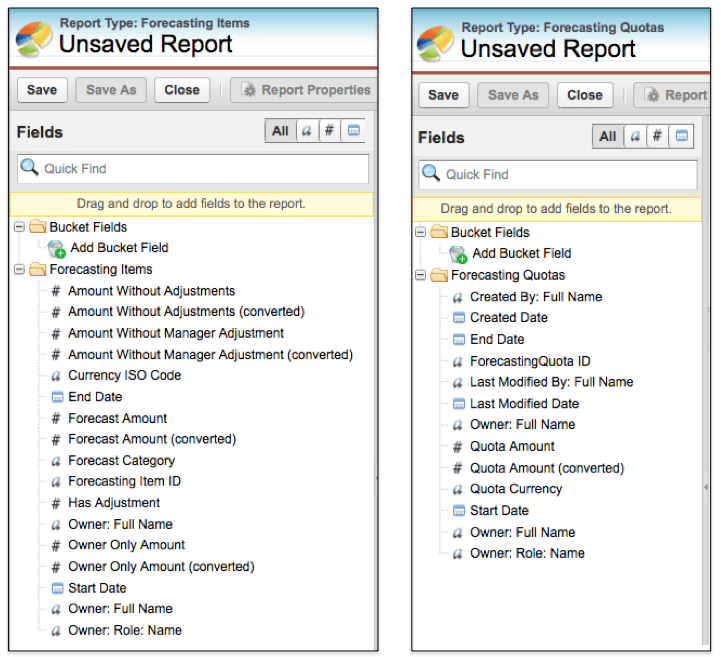
- Out of the box reporting offers 1) Forecast Items, and 2) Forecast Quotas, which doesn’t allow you to to compare Actual versus Plan without creating a Custom Report Type.
- If you want to report on forecasts, quotas, and opportunity information, a joined report is required, with all the inherent dashboard limitations (e.g., no Dashboard Table or Metric options).