Debug Logs for the Non-Developer: Part 2
(a.k.a. How to Read Debug Logs)
In Debug Logs for the Non-Developer: Part 1 (a.k.a. Why Debug Logs are our friend), I talked about why debug logs are great and how to set them up in an org, but how exactly do you go about reading them? All those numbers and letters in black, mono-space font may espouse the sense that what is written is for developers only, but don’t let the font throw you off. The actual text is more intelligible than you might think. And perhaps the best kept secret about debug logs is that you don’t actually have to understand every line (or even most lines) to be able to use them effectively to investigate issues. Often, a simple search through the debug log for the word “ERROR” will take you straight to the part of a transaction that caused problems. From the error line, you can immediately deduce the problem from the error message, or from the location of the error in the transaction.
But just looking for error messages in debug logs isn’t a foolproof plan, because not all errors will generate intelligible error messages. And while complete understanding of a debug log is far from necessary, having general knowledge of the parts of a debug logs can be very useful in tracking down an elusive problem.
So what are debug logs made of?
Debug logs all have the same format, so once you understand the parts for one, you understand the parts for all. Here is full log from a very simple transaction:
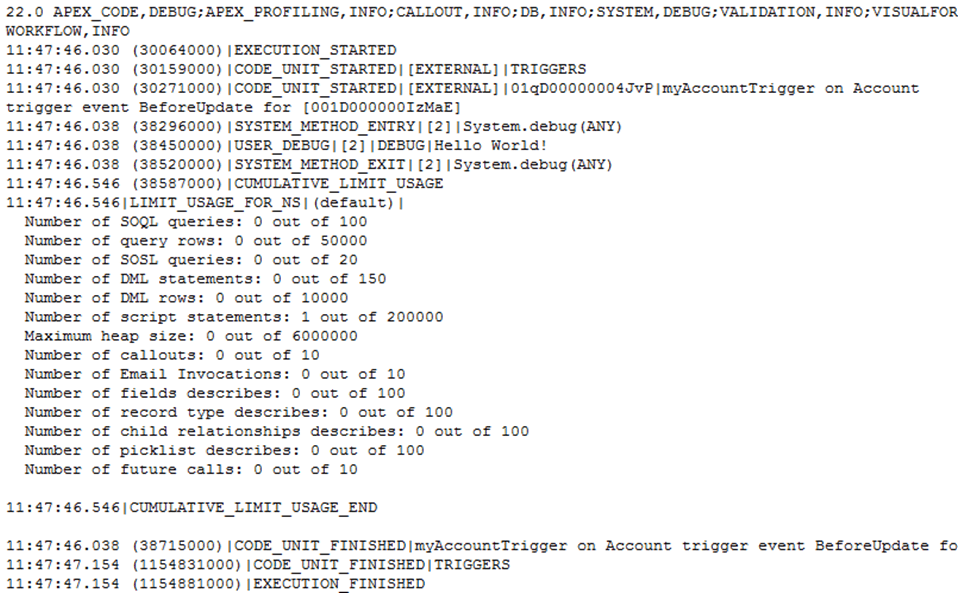
Once able to “read” the log, you’ll see that the transaction was initiated because a user edited an existing Account record which fired off a trigger on the Account object that wrote “Hello World!” to the debug log. After that, the transaction finished without tripping any validation rules of workflow. By the end of this post, you’ll be able to glean this kind of information for all debug logs.
A debug log is made up of the following:
- Header
- Execution Unit
- Code Units
- Cumulative Resource Usage
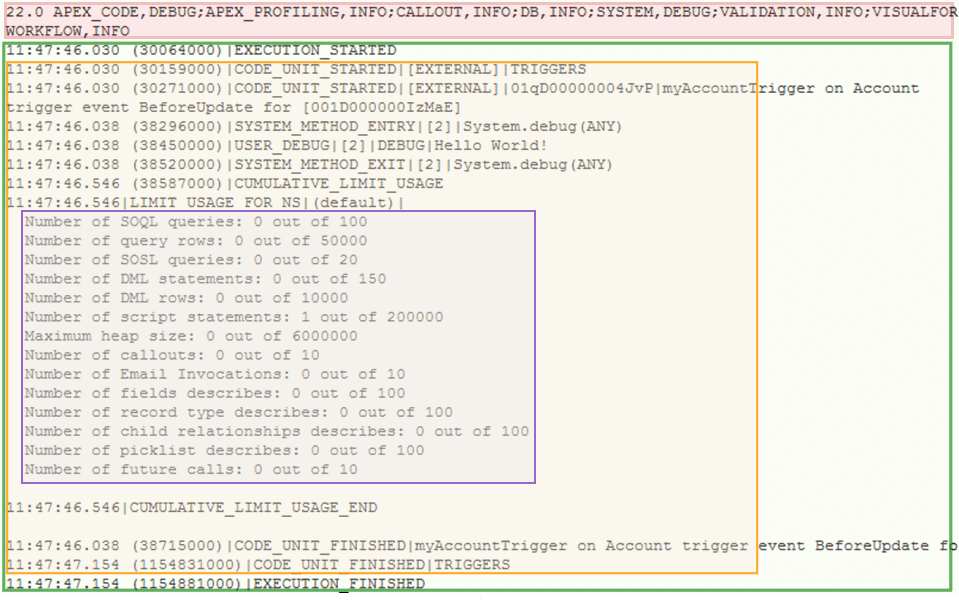
The Header portion of the log sits at the very top and the text is in all caps (outlined and shaded in red in the above image). You don’t really have to worry about it, but in case you were curious:
- The number at the very beginning of the Header gives the API version used during the transaction
- The text after the number lists the filter settings (log category and level) used during a log’s creation
The Execution Unit is essentially the entire transaction and, in the debug log, refers to everything after the Header section of the log.
A Code Unit, according to Salesforce documentation, “is a discrete unit of work within a transaction.” Please see the following list for some examples:
- Workflow
- Triggers
- Validation rules
- Approval processes
- Web service calls
The list above is far from exhaustive, but you get the picture. A Code Unit is denoted by CODE_UNIT_STARTED at the beginning and CODE_UNIT_FINISHED at the end. Often, errors occur inside a specific code unit so knowing where a code unit begins and ends lets you know what kind of process (e.g. trigger, validation rule, etc.) was running when the error occurred.
At the end of many code units, usually the ones that involve Apex code in some way, there’s a log of the cumulative resources used up by that point of the transaction. Because there are a variety of limits (governor limits) imposed on a transaction, such as the number of queries (retrieval of information from the database) or DML operations (e.g. inserting, updating, etc. records) allowed, this section helps determine if an error is due to governor limits being surpassed.
So how do we read a specific debug log line?
All lines related to a Code Unit have the same formatting: Time Stamp | Event Identifier.
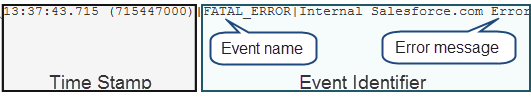
In most circumstances, you can ignore the Time Stamp and just look at the Event Identifier. The first portion of the Event Identifier gives the name of the event. So if you were looking for the beginning of a Code Unit, you would look for the event name “CODE_UNIT_STARTED” after a log line’s Time Stamp. The event name gives you an idea of what kind of event is taking place. See the list below for some examples of event names and what they indicate:
- DML_BEGIN – some action, such as an update or delete, is going to be performed on a record
- VALIDATION_RULE – indicates that a validation rule has fired
- VALIDATION_FORMULA -gives the validation rule’s formula
- VALIDATION_PASS – indicates that a validation rule has passed
- WF_FIELD_UPDATE – indicates a workflow field update has fired
- WF_EMAIL_ALERT – indicates an email alert has fired
As you can see from the event names themselves, they are fairly self-explanatory.
In the example debug log line image shown above, the event name is “FATAL_ERROR” which indicates that an error occurred which was severe enough to stop the transaction. Often, the error message following the event name “FATAL_ERROR” is clear and intelligible enough to determine what exactly went wrong. However, in the example line given above, the error message “Internal Salesforce.com Error” is not very helpful. And the message originally displayed through the user interface looked like this:
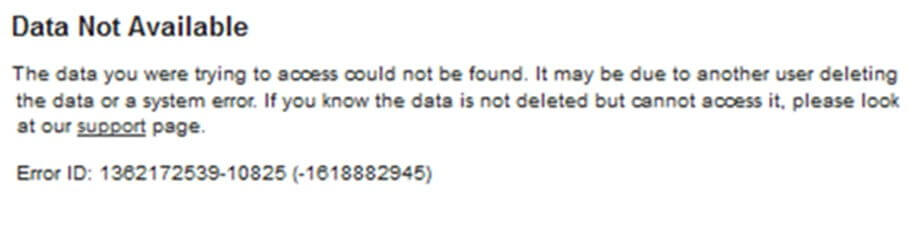
Also, not very helpful. This is where it helps to backtrack up the debug log and figure out what happened right before the error.
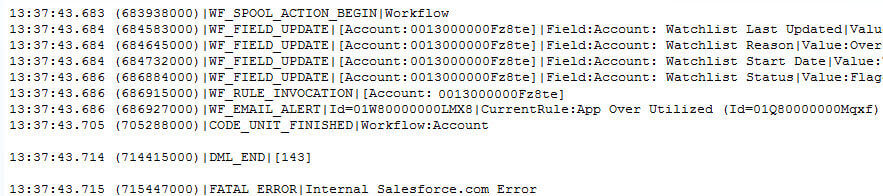
From the above screenshot, you can see that a series of workflows were fired off before the “FATAL_ERROR” because the event names all begin with WF (which I assume stands for WorkFlow). The two lines just before the “FATAL_ERROR” line with the event names “DML_END” and “CODE_UNIT_FINISHED” merely indicate the end of discrete processes within the transaction and can be ignored for our purposes. The first meaningful line occurs right before the code unit workflow on Account finished. The event name is “WF_EMAIL_ALERT” which indicates that the last action launched before the error was a workflow email alert. The rest of the line gives details regarding the email alert. The Id following the event name is the email alert’s Id and the text after “Current Rule” gives the name of the workflow rule that fired off the email alert (with the rule’s Id in parentheses). With the email alert’s Id, we can then navigate to that particular email alert, which in this case produced the following email alert record:
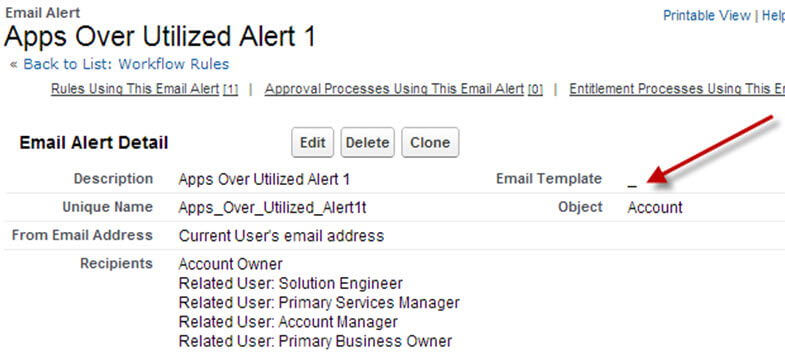
As you can see from the above screenshot, the problem is that the email alert no longer has an email template attached. It’s likely that since the creation of the email alert, someone deleted the email template which would cause an error every time this email alert was fired since it no longer had an email template. This problem can be easily resolved by either removing the email alert from the workflow or attaching a different email template to the email alert.
Thus, we have successfully debugged a vague error using the debug log. This error is actually no longer reproducible since newer releases of Salesforce now prevent an email template deletion if the said email template is in use by an email alert. But I’m sure there will plenty of Salesforce bugs in your future that will require the use of debug logs.
Happy debugging!