Debug Logs for the Non-Developer: Part 1
(a.k.a. Why the debug log is our friend)
At first glance, debug logs might appear quite intimidating, archaic, and perhaps even downright ugly. But don’t let appearances discourage you: debug logs can be indispensable tools for developers and non-developers alike. When an issue arises from an unclear source, debug logs are the best, and sometimes the only, place to go in order to sleuth out a problem. And before you think, “I can’t possibly work through all that gobbledy-gook code-looking stuff,” know two things: 1) debug logs read more easily than they appear at first glance, often with quite naturally intelligible messages, and 2) you don’t actually have to wade through all that “gobbledy-gook” to retrieve meaningful, useful information. More often than not, if you just search for the word “ERROR” or “FATAL_ERROR,” you’ll be taken right to where an occurring problem. But more on that later.
So what exactly is a debug log?
A debug log is a record of information about database operations, system processes, and errors that occur when Salesforce is executing a transaction. It can contain information regarding:
- Apex code such as:
- Triggers
- Classes
- Visualforce Controllers
- Callouts to external web services
- Database operations such as:
- Inserting a record
- Updating a record
- Deleting a record
- Validation rules
- Workflow rules and actions
- Profiling (performance, resource utilization, etc.)
For example, let’s say a new Account record is created that passed all validation rules and caused some workflow rules to fire. The debug log for that particular transaction would include everything that went into the Account record’s creation, including which validation and workflow rules were fired and in what order. That is why the logs are so handy for troubleshooting. If an initially presented error message is unhelpful, you can trace what occurred in the transaction immediately before the error to quickly narrow down the possible suspects.
So how do we get started?
Let’s say you come across this error one day:
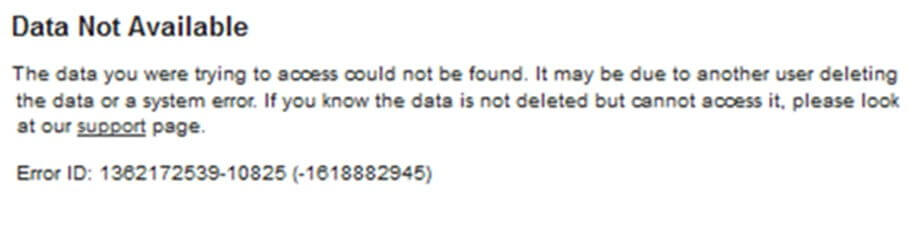
Clearly not the most helpful error message in the world. Debug logs are the logical place to turn for some investigative work. The first thing to know is that debug logs are disabled by default (which makes sense; why record every Salesforce transaction for all eternity when most of them won’t even get looked at?). And they can only be enabled on a per User basis; there is no toggle-debug-logs-for-the-entire-org button. (Please note: If you need to login as someone else to reproduce an error specific to that User, you need to make sure you have the debug logs set to monitoring that User’s account, not just your own even though you are merely masquerading as that User.)
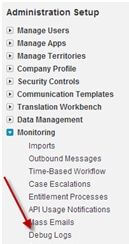
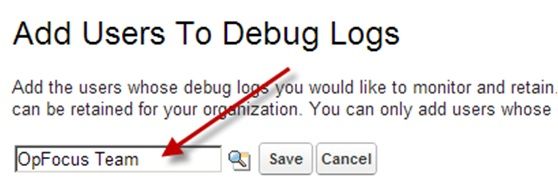
To enable debug logs for a specific User, go to Setup | Administration | Monitoring | Debug Logs and click on “New” button, then choose a User to monitor. You can monitor multiple Users and your org can retain up to 50MB of debug logs.
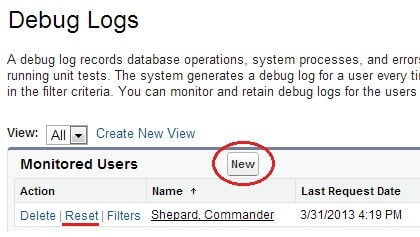
Every monitored User starts off with 20 allowed monitored transactions that will naturally run out unless the “Reset” link is clicked (which resets the count back to 20). Having to remember to constantly reset the debug logs can be quite any annoyance, especially if your investigative work might take quite a few transactions. There is a workaround for that which I’ll get to in a bit.
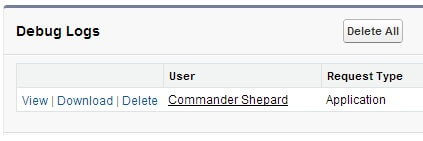
There are two ways to view the logs, “View” and “Download.” “View” displays the selected debug log inside of Salesforce while “Download” displays just the log as a text file.
While either option essentially displays the same data, I recommend using the “View” option because it can circumvent the need to constantly reset monitoring for debug logs. Salesforce is smart enough to know that if you have a have debug log open, you most likely want to keep monitoring on. So as long as you have a debug log open in Salesforce (using the “View” option) during your current session, you won’t need to constantly reset debug log monitoring no matter how many transactions take place. I usually keep my debug logs open in one window/tab while running actual transactions in a separate window/tab until I’m done troubleshooting. This method works as long as you are using the same browser.
Hopefully by now, I’ve convinced you to take a second look at debug logs. Not only are they very useful, but are also quite simple to enable and manageable; you don’t have to worry about a flood of debug logs once you turn the functionality “on.” And reading them is not some form of rocket science, as you’ll discover in my next post where I’ll walk through how to read a debug log. Stay tuned!