Analytic Cloud Lingo: Learning the Language to Surf the Wave
Wave Analytics (Wave), in its simplest form, is a Salesforce (and therefore cloud-based) reporting tool. The tool itself is super powerful and very cool, but its ability to pull in data from outside sources is what sets it apart the most from your Salesforce Report Builder. Wave also allows you to visualize and dissect your data like never before, easily share the data with your team, and take Actions from inside the tool.
Unfortunately, entering a conversation about Wave before learning the lingo can leave you feeling lost at sea. We gathered a list of the basic terms below to help you navigate the waters.
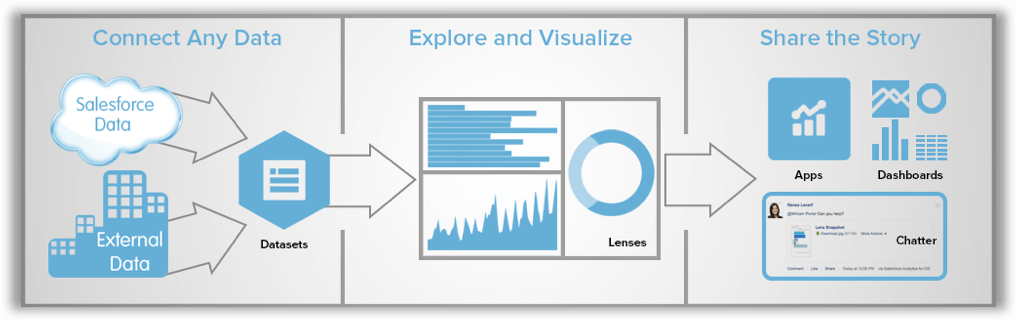
In Wave it all begins with Datasets. These are the components of raw data that you pull into Wave from either Salesforce or from an outside application, otherwise known as External Data.
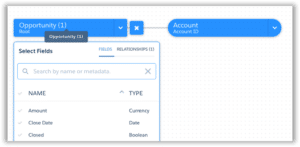
The Dataset Builder is a point-and-click interface that allows you to extract data from Salesforce objects in order to create a Dataset.
Unless you’re a robot, it’s hard to read raw data and discover anything meaningful. We explore and organize the data until we find significant information. The end result is a Lens that you can save and share. I think of a Lens as synonymous with a Salesforce report.
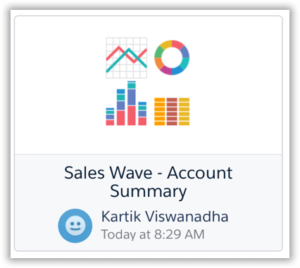
A collection of typically-related Lenses visualized on one page is a Dashboard. We know that one!
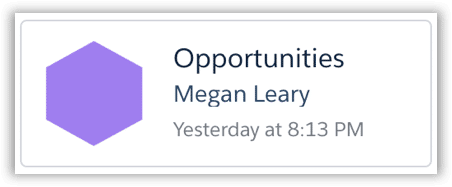
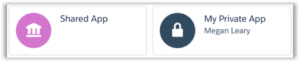
An App houses a group of Dashboards, Lenses, and Datasets. Think “folder.” You can control both security to the Apps’ content and the associated icon.
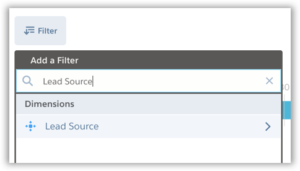
A Dimension is added to a dataset via a Filter or Group to drill into a qualitative value. For instance, if you want to group your Accounts by region, filter out certain Product families, or look at Opportunities by stage, you are using Dimensions on your dataset.
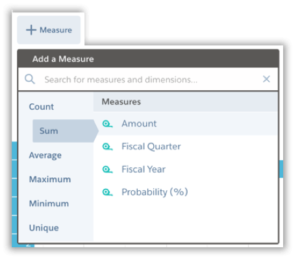
A Measure is quantitative value or something on which you can do math. If you’re looking at total revenue or the average deal size of Opportunities, then you are using Measures on your Dataset.
You can Group and Filter your Dataset in the same way you do in your Salesforce reports today.
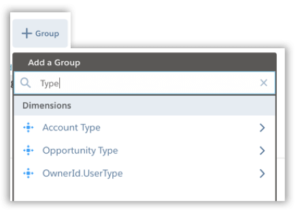
The interface where you Filter, Group, and add Dimensions and Measures to your Dataset is called the Explorer. It has fun animations and color codes your groups.
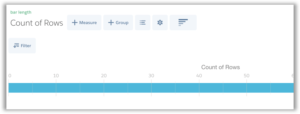
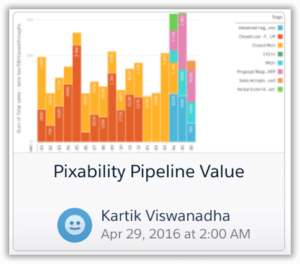
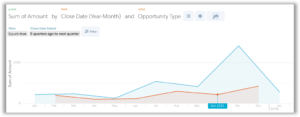
Wave not only lets you dive into Datasets in a fun and meaningful way, but the options for Visualizations are plentiful. A Visualization is a chart, metric, or graph that allows the user to really see and understand the Dataset.
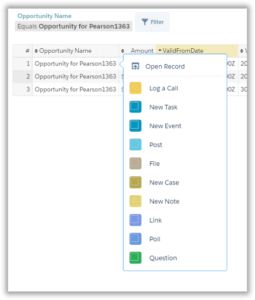
Actions are located on Lenses and Dashboards. They let you create or modify Salesforce records, such as logging a call or creating a new Task.
You are now ready to ride the Wave! Once you get your sea legs come back and let us know what we missed and what your advice is for new surfers.