9 Tools in Salesforce to Help You Understand Your System
At OpFocus we’re often looking under the hood of Salesforce instances, and over time have developed a set of places within each system to look at to understand how things are set up and what is in use. These tools might be used by a new admin or executive sponsor, looking at an inherited system for the first time, or by a long time admin trying to see their system with a fresh set of eyes. When looking at a system for the first time, our typical system tour runs through:
1. Company Information Page
(Accessed via Setup > Company Profile > Company Information
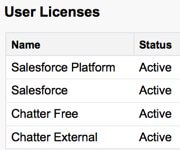
 This page is often where we start when looking at a new system. In among system defaults, it shows high level data and file storage usage and API Requests in the past 24 hours. It also lists User Licenses purchased and consumed (and their contract expiration dates), as well as Feature Licenses purchased and consumed. In many instances we discover licenses that someone doesn’t realize that they own, as well as find underutilized goodies. Common examples include Platform Licenses (which can be bought or come free with AppExchange Apps such as DocuSign and Xactly Incent Express) or long forgotten Community licenses.
2. Checkout Summary
(Accessed via Setup > Checkout Summary > Proceed to Checkout)
Checkout is a goldmine of all past purchase history, contract details such as renewal dates and license costs, payment status, and quotes. It is also where you can find your current Sales Rep’s contact info and update your billing information. To view Checkout a user must be a System Administrator.

3. Storage Usage
(Accessed via Setup > Data Management > Storage Usage)
The Storage Usage page shows us Data and File Storage consumed versus your system’s limit, and then:
- Current Data Storage Usage by Object (record counts per database table)
- Current File Storage Usage
- Top Users by Data Storage Usage
- Top Users by File Storage Usage
You can quickly get a sense of what is NOT being used in the system, and also see what may be in use now (or was at some point in the past). Tasks up at the top of the list generally indicates that a marketing automation system such as Marketo or Pardot is in use. Note that on most objects in Salesforce each record consumes 2KB of data storage. To get a sense of what objects are currently in use, you might create Reports on each object listing records by create and last modified dates.
4. Sharing Settings
(Accessed via Setup > Security Controls > Sharing Settings)
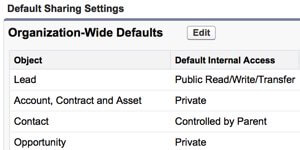
 When you first buy Salesforce it is wide open- everyone can literally see and edit everything as settings for most objects are either Public Read/Write or Public Read/Write/Transfer (for Leads and Cases). Typically as organizations grow they look to lock things down, some too late for their own good. The Sharing Settings page pulls double duty, listing out both Organization Wide Defaults and Sharing Rules. Org Wide Defaults set the base level of access to records, object by object, for Users in a system; as Org Wide Defaults are lowered, Sharing Rules are used to handle exceptions.
5. Installed Packages
(Accessed via Setup > Installed Packages)
Each app you install from the AppExchange appears under Installed Packages. This is often like a stroll down memory lane or a rummage through a cob web strewn attic, with a variety of long forgotten apps listed. Note that the absence of an app means it is clearly not in use, but the presence of an app doesn’t mean it is currently being used. Many admins install things in production to try them out, then forget about them, and often apps remain installed for years.
6. System Overview
(Accessed via Setup > Monitor > System Overview)
The System Overview page shows progress toward a variety of system limits, such as Objects, Apps, Apex Triggers, Visualforce Pages, Tabs and so on. In particular this is a good way to get a sense of how much custom business logic (Apex) and how many custom pages (Visualforce) have been implemented.
7. Login History
(Accessed via Setup > Manage Users > Login History)
We now have the ability to download the most recent 20,000 login attempts via this totally redesigned Login History tool. It shows both successful and unsuccessful attempts, for all users and for all access methods. From here you can learn how users are logging in to the system and the types of apps that are integrated. We can also learn where people are logging in from (their IP addresses) and the platforms they are using.
8. View Setup Audit Trail
(Accessed via Setup > Security Controls > View Setup Audit Trail)
This little known gem allows you to download up to six months of administrative and set up changes within a system. It lists the date of each change, who made the change, and what was changed for nearly 100 types of administrative, security, data, development, and customization updates. For a new administrator this can show who else has been making changes to the system, and how recently. Another nice use for it is for an administrator’s post vacation review of what was done while they were away.
9. Sandboxes
(Accessed via Setup > Sandboxes)
This page shows what Sandboxes have been purchased and what have been set up. A Salesforce instance with no Sandboxes, for example, likely has no Apex development going on and no integrations in place. Sandboxes are used as development, test and training environments, with different and higher levels of functionality and cost as you move to the right in the screenshot below. Both the list of Sandboxes and Sandbox history can be useful in getting a sense of what development is going on and where.

This list, while long, is not exhaustive, and we expect Salesforce to continue to add ways to glean information about a system. Please use the Comments section below to share other useful tools you’ve found for learning about a particular system.


