How to Understand Sales Results: Dashboard Dynamism & Filters
 The Salesforce Spring ’14 release is upon us, and includes a new feature related to Dashboard Filters (which I’ll discuss below) that reminded me how useful Dashboard filtering can be for sales managers, and is especially true when you want deeper sales results insights from a single dashboard with just a few clicks.
Dynamic Dashboards
By now, Dynamic Dashboards are a well used feature that allows for three key reasons: view Dashboard as logged in User, view Dashboard as a specified User, and change running User (note that this requires special Profile permission).
- “View Dashboard as logged in User” runs a Dashboard through the eyes, permissions, and record access of the current User, and lessens the administrative burden of having to create a unique Dashboard for each sales rep
- “View Dashboard as a specified User” runs a dashboard through the eyes, permissions, and record access of a specified User regardless of the eyes, permissions, and record access of the currently logged in User. This is valuable for sharing team results or summarized individual results across a team without providing access to private specific details (as long as the underlying reports have the appropriate security settings).
- “Change running User” allows a sales manager to quickly view each sales rep’s results with simply by changing the name of the running User on the dashboard.
Dashboard Filters
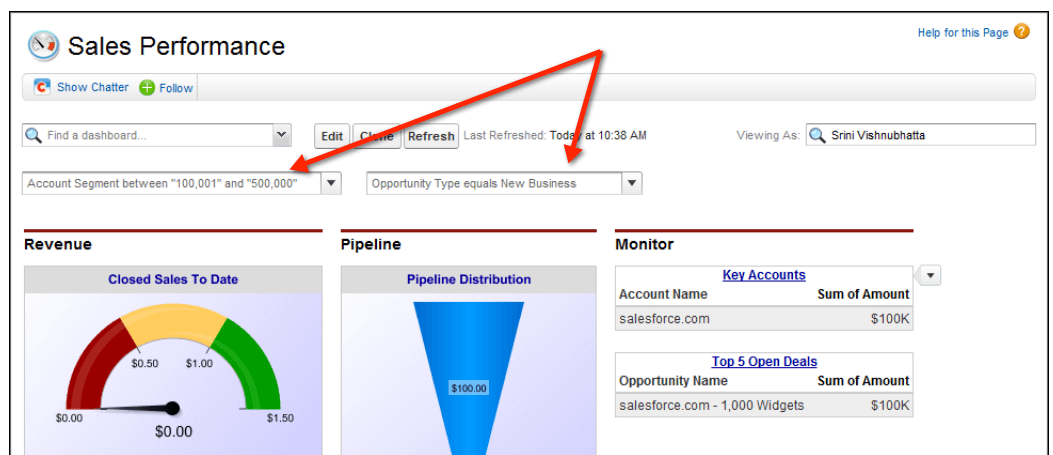
Filters allow one Dashboard to serve a variety of needs. This can be especially useful during a sales team meeting or during a one-on-one coaching session.
- Add a Filter by Close Date that includes Current Month, Current Fiscal Quarter, and Current Fiscal Year to look at pipeline across time
- Combine the previous Filter with an Opportunity Stage filter that includes Closed Won or Closed Lost across different periods to see how performance is changing
Dashboard Filters:
- Up to 3 Filters per Dashboard (e.g., by Close Date, Stage, etc.)
- Up to 10 options defined by Filter operators and values (e.g., Closed Won, Current Fiscal Year, etc.)
- Filter options can be increased up to a maximum of 50 by contacting Salesforce.com
Named Dashboard Filter Values
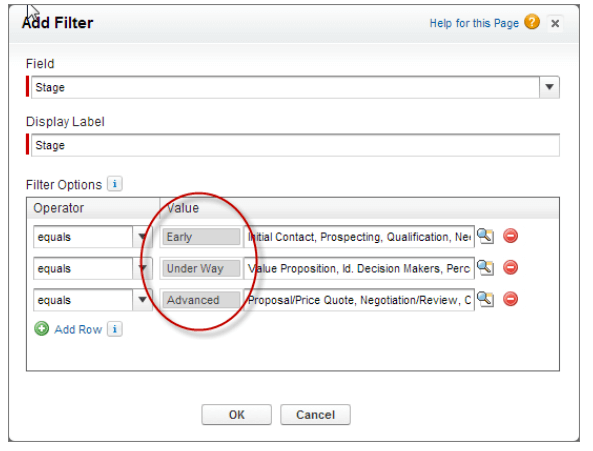
 New for Spring ’14 is the named dashboard filter values functionality, similar to Report Bucketing, whereby a group of values can be assigned a nickname. Salesforce’s example is by Opportunity Stage, with the groupings ‘Early,’ ‘Under Way,’ or ‘Advanced.’ For example, Early includes Stages like “prospecting” and “qualification,” Under Way might contain “value proposition” and “ID decision makers,” and Advanced could include “proposal” or “contract negotiation.” Each one of the these nicknames contains multiple Stages and allows for the reduction of ‘Filter clutter.’
Limitations and Gotchas
From Salesforce.com:
- Filters aren’t available for dashboards with Visualforce or s-control components
- It’s not possible to filter on bucket fields
- Scheduling or emailing a filtered Dashboard returns unfiltered data
- You can’t filter data on a Joined Report in dashboard view or add a Filter to a Dashboard that only has Joined Reports
The main gotcha related to Dashboard Filters is ensuring that all the Dashboard components refer to the same underlying data as the Filters, otherwise applying Filters will cause error messages for certain components.
For example, if a Dashboard contains components related to Opportunities and Activities, and Filters are related to Opportunity Stage and Close Date, applying those Filters will cause all components related Activities to return an error message.
[tagline_box backgroundcolor=”” shadow=”yes” shadowopacity=”0.1″ border=”1px” bordercolor=”” highlightposition=”left” link=”https://opfocus.com/contact-us” linktarget=”_self” buttoncolor=”blue” button=”Contact Us” title=”Want to build smart Dashboards for your sales team?” description=”Don’t have time or bandwidth to do it alone? Let us know — we’re happy to do a free assessment of your current Reporting and help you outline a plan of attack!” animation_type=”slide” animation_direction=”left” animation_speed=”0.7″][/tagline_box]


