Historical Trending: New Salesforce Feature to Coach Your Sales Team
 Following up on Brian’s excellent post on the Top 5 Sales Cloud Features in Salesforce Winter ’14, I thought it would be valuable to drill into one of the new and powerful Winter ’14 features – Historical Trends Reporting (Winter ’14 release notes p., 192). As any good Sales Manager knows, things change during the lifecycle of a deal – stage, close date, deal size, etc. That said, the more a deal gets pushed out or the more times the deal size changes, the greater the potential risk of the deal moving to closed lost. Having a macro view of those risks across a sales team, region, or even the entire company can be incredibly valuable – and Salesforce has just made access to those business insights easier than ever.
Historical Trending…so what’s new?
[separator top=”5″ style=”single”]
So what is available with the new Historical Trend Reporting functionality? Well, specifically:
- Three months of historical data available for analysis
- Five snapshot dates for comparison (fixed or rolling dates by month, week, or day)
- Four historical filters
What do these all mean? Let’s say you want to report on all open opportunities with a close date in the current or next fiscal quarter, and want to see where that close date, stage, or deal amount has changed for your weekly sales team meeting to see how deals are progressing. Typically, you’ll want to see changes from the first day of the week this week, first day 1 week ago, first 2 weeks ago, and first 3 weeks ago so you can set the report filters to the following:
[imageframe lightbox=”no” style=”dropshadow” bordercolor=”” bordersize=”0px” stylecolor=”” align=”center” animation_type=”0″ animation_direction=”down” animation_speed=””]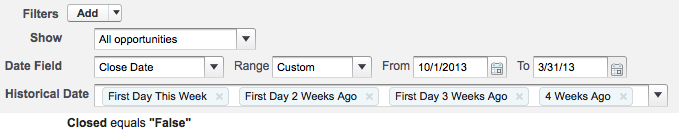 [/imageframe]
Note: While month-to-month trending is available, such as 1st day of this month, first day 1 month ago, first day 2 months ago, etc., this feature works best with day-to-day and week-to-week historical trending and wasn’t designed with month-to-month trending in mind.
[imageframe lightbox=”no” style=”bottomshadow” bordercolor=”” bordersize=”0px” stylecolor=”” align=”left” animation_type=”0″ animation_direction=”down” animation_speed=””]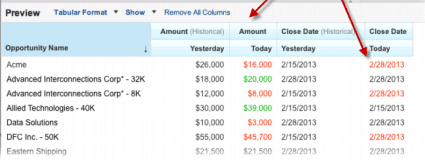 [/imageframe]
Now, instead of having to pore through reports, or create custom formula fields, changed data automatically shows up in red or green. It’s perfect for quickly seeing the information you need.
[imageframe lightbox=”no” style=”bottomshadow” bordercolor=”” bordersize=”0px” stylecolor=”” align=”right” animation_type=”0″ animation_direction=”down” animation_speed=””]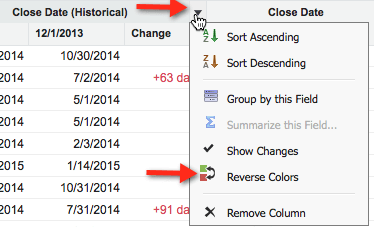 [/imageframe]If you wish to reverse the color configuration from red to green or green to red for a particular column, click the customize button, and then the drop down menu for the column in question, and finally, click the ‘reverse-colors icon.
[separator top=”15″ style=”none”]
Guide Your Team With Tangible Data
[separator top=”5″ style=”single”]
What makes Salesforce’s Historical Trending a fantastic tool for Sales Managers is you now have data that you can quickly use to coach your sales team. Conversations and sales meetings will seem more productive. Instead of the common question of “which deals do you think will close this week,” you can see which deals immediately need help so you can ask “how can I help you close this particular deal?”
Take for example the report above. If this report reflected your team’s opportunities, you’d probably want to contact and coach the sales rep for Acme since the deal got pushed out further and for $10,000 less than expected. Or you could give kudos to the sales rep for Allied Technologies for increasing the expected opportunity amount by $9,000.
[dropcap]”W[/dropcap]hat’s measured improves”
― Peter F. Drucker
Taking Peter Drucker’s advice into account, if you can measure and monitor your sales data, you can improve it by quickly seeing the opportunities that need more attention. Plus, your sales reps can use the reports individually to tell what’s going on with their pipeline and see where they are at all times.
[separator top=”15″ style=”none”]
Configuration for System Admins
[separator top=”5″ style=”single”]
[imageframe lightbox=”no” style=”bottomshadow” bordercolor=”” bordersize=”0px” stylecolor=”” align=”right” animation_type=”0″ animation_direction=”down” animation_speed=””]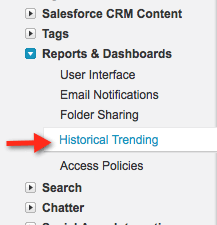 [/imageframe]If you want to get started with Historical Trending right away in your Salesforce instance, forward this post to your Salesforce Admin to follow these configuration steps.
Go to Customize > Reports and Dashboards > Historical Trending.
Note that Amount, Close Date, Forecast Category, Probability, and Stage are always trended. Other fields for Historical Trend tracking can be selected below.
[imageframe lightbox=”no” style=”bottomshadow” bordercolor=”” bordersize=”0px” stylecolor=”” align=”center” animation_type=”0″ animation_direction=”down” animation_speed=””]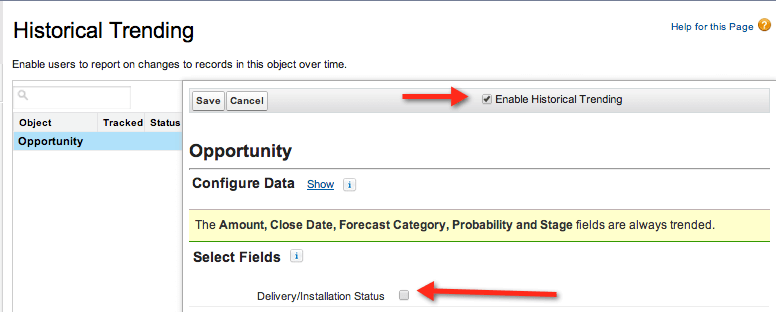 [/imageframe]
Limitations
[separator top=”5″ style=”single”]
Some limitations to consider when using Historical Trend Reporting include the following:
- Each historical trend report can contain up to 100 fields. In Opportunity reports, this includes the standard preselected fields, which can’t be disabled
- The following field types are supported: Number, Currency, Date, Picklist
- Internet Explorer 6 is not supported
- The Report Wizard is not supported – Historical trend reports can only be created with the Report Builder
[tagline_box backgroundcolor=”” shadow=”yes” shadowopacity=”1″ border=”2px” bordercolor=”” highlightposition=”top” link=”https://opfocus.com/services/the-opfocus-strategic-roadmap/” linktarget=”_self” buttoncolor=”” button=”Contact Us” title=”Do you have any questions regarding this new feature or any related ideas? Please, leave a comment below! Also, don’t hesitate to reach out to our team for additional tips and Best Practices.” description=”” animation_type=”slide” animation_direction=”right” animation_speed=”.8″][/tagline_box]
Image credit: http://commons.wikimedia.org/wiki/File:Compass_Icon.png and Salesforce.com Winter ’14 Release Notes p. 192
